Makoons Value Chain Map
One of the strongest tools available for us as we strategize economic transformation possibilities is the mapping of our value chains. Supply chain mapping centers the people and processes needed to get from origin to product, from farm to table. This Value chain traces resources and products from their origin to their use, but also aims to map all of the activities and relationships involved in that lifecycle. Our mission with this value chain map is to provide a tool to support in identifying gaps, networking for community-based solutions, illuminating traditional Anishinaabe food ways and the continued building of community self determination within the food economy of the Chequamegon Bay area.
Our Living Map

Click this Icon to select Inputs

Click this Icon to view the full map
Content:
Producers and Harvesters: By Category (Primary)
Farmer Markets & Stores: Selling Local Foods
Markets: Grocers, Aggregators, and Farmers Markets
Farm Inputs: Energy, Seed, Feed, Hay, Etc
Processing + Distribution
Each section contains input value & networking information.
This map is “Living”, meaning that it is annually updated to reflect the current state of our value chain.
This Map was last updated on: July, 2026
Traditional Food Economy
Hunting, Gathering & Anishinaabe Abundance
Our traditional food systems have, and will always be the backbone of sustainable food economies within our region. We have assembled this information to share about the traditional abundance that is available, as well as to provide resources to help inform the development of sustainable relationships and stewardship practices with our traditional foods and food-ways.
Public Resources
-
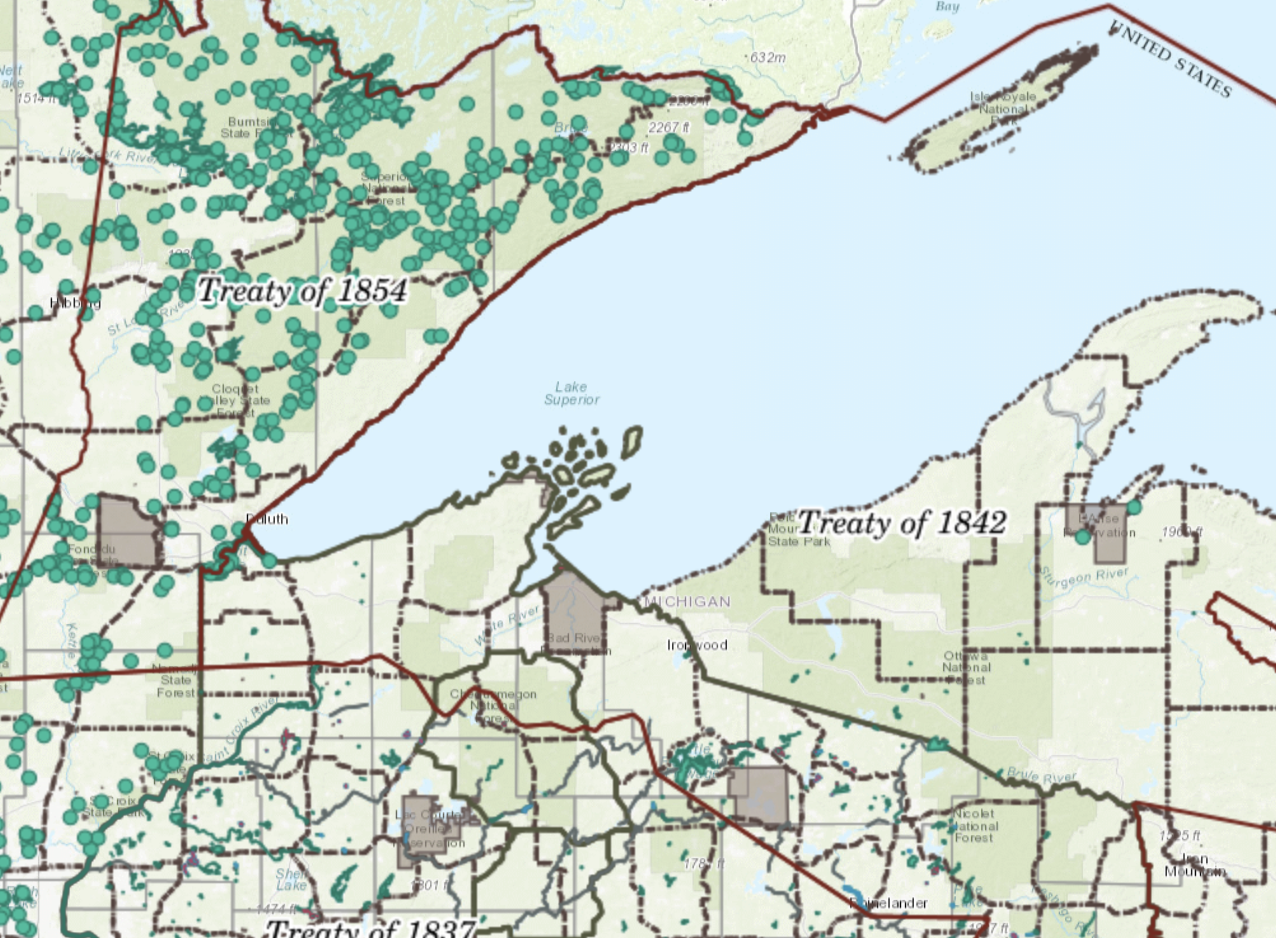
The Great Lakes Indian Fish & Wildlife Commission is commonly known by its acronym, GLIFWC. Formed in 1984, GLIFWC serves eleven Ojibwe tribes in Minnesota, Wisconsin, and Michigan who reserved hunting, fishing, and gathering rights in the 1836, 1837, 1842, and 1854 Treaties with the United States government.
GLIFWC provides natural resource management expertise, conservation enforcement, legal and policy analysis, and public information services in support of the exercise of treaty rights during well-regulated, off-reservation seasons throughout the treaty-ceded territories.
-
Abundance Illustration coming soon…
GLIFWIC Treaty Resources
View the The Great Lakes Indian Fish & Wildlife Commission’s Treaty Resource Map!

Sustainable Hunting, Fishing & Gathering
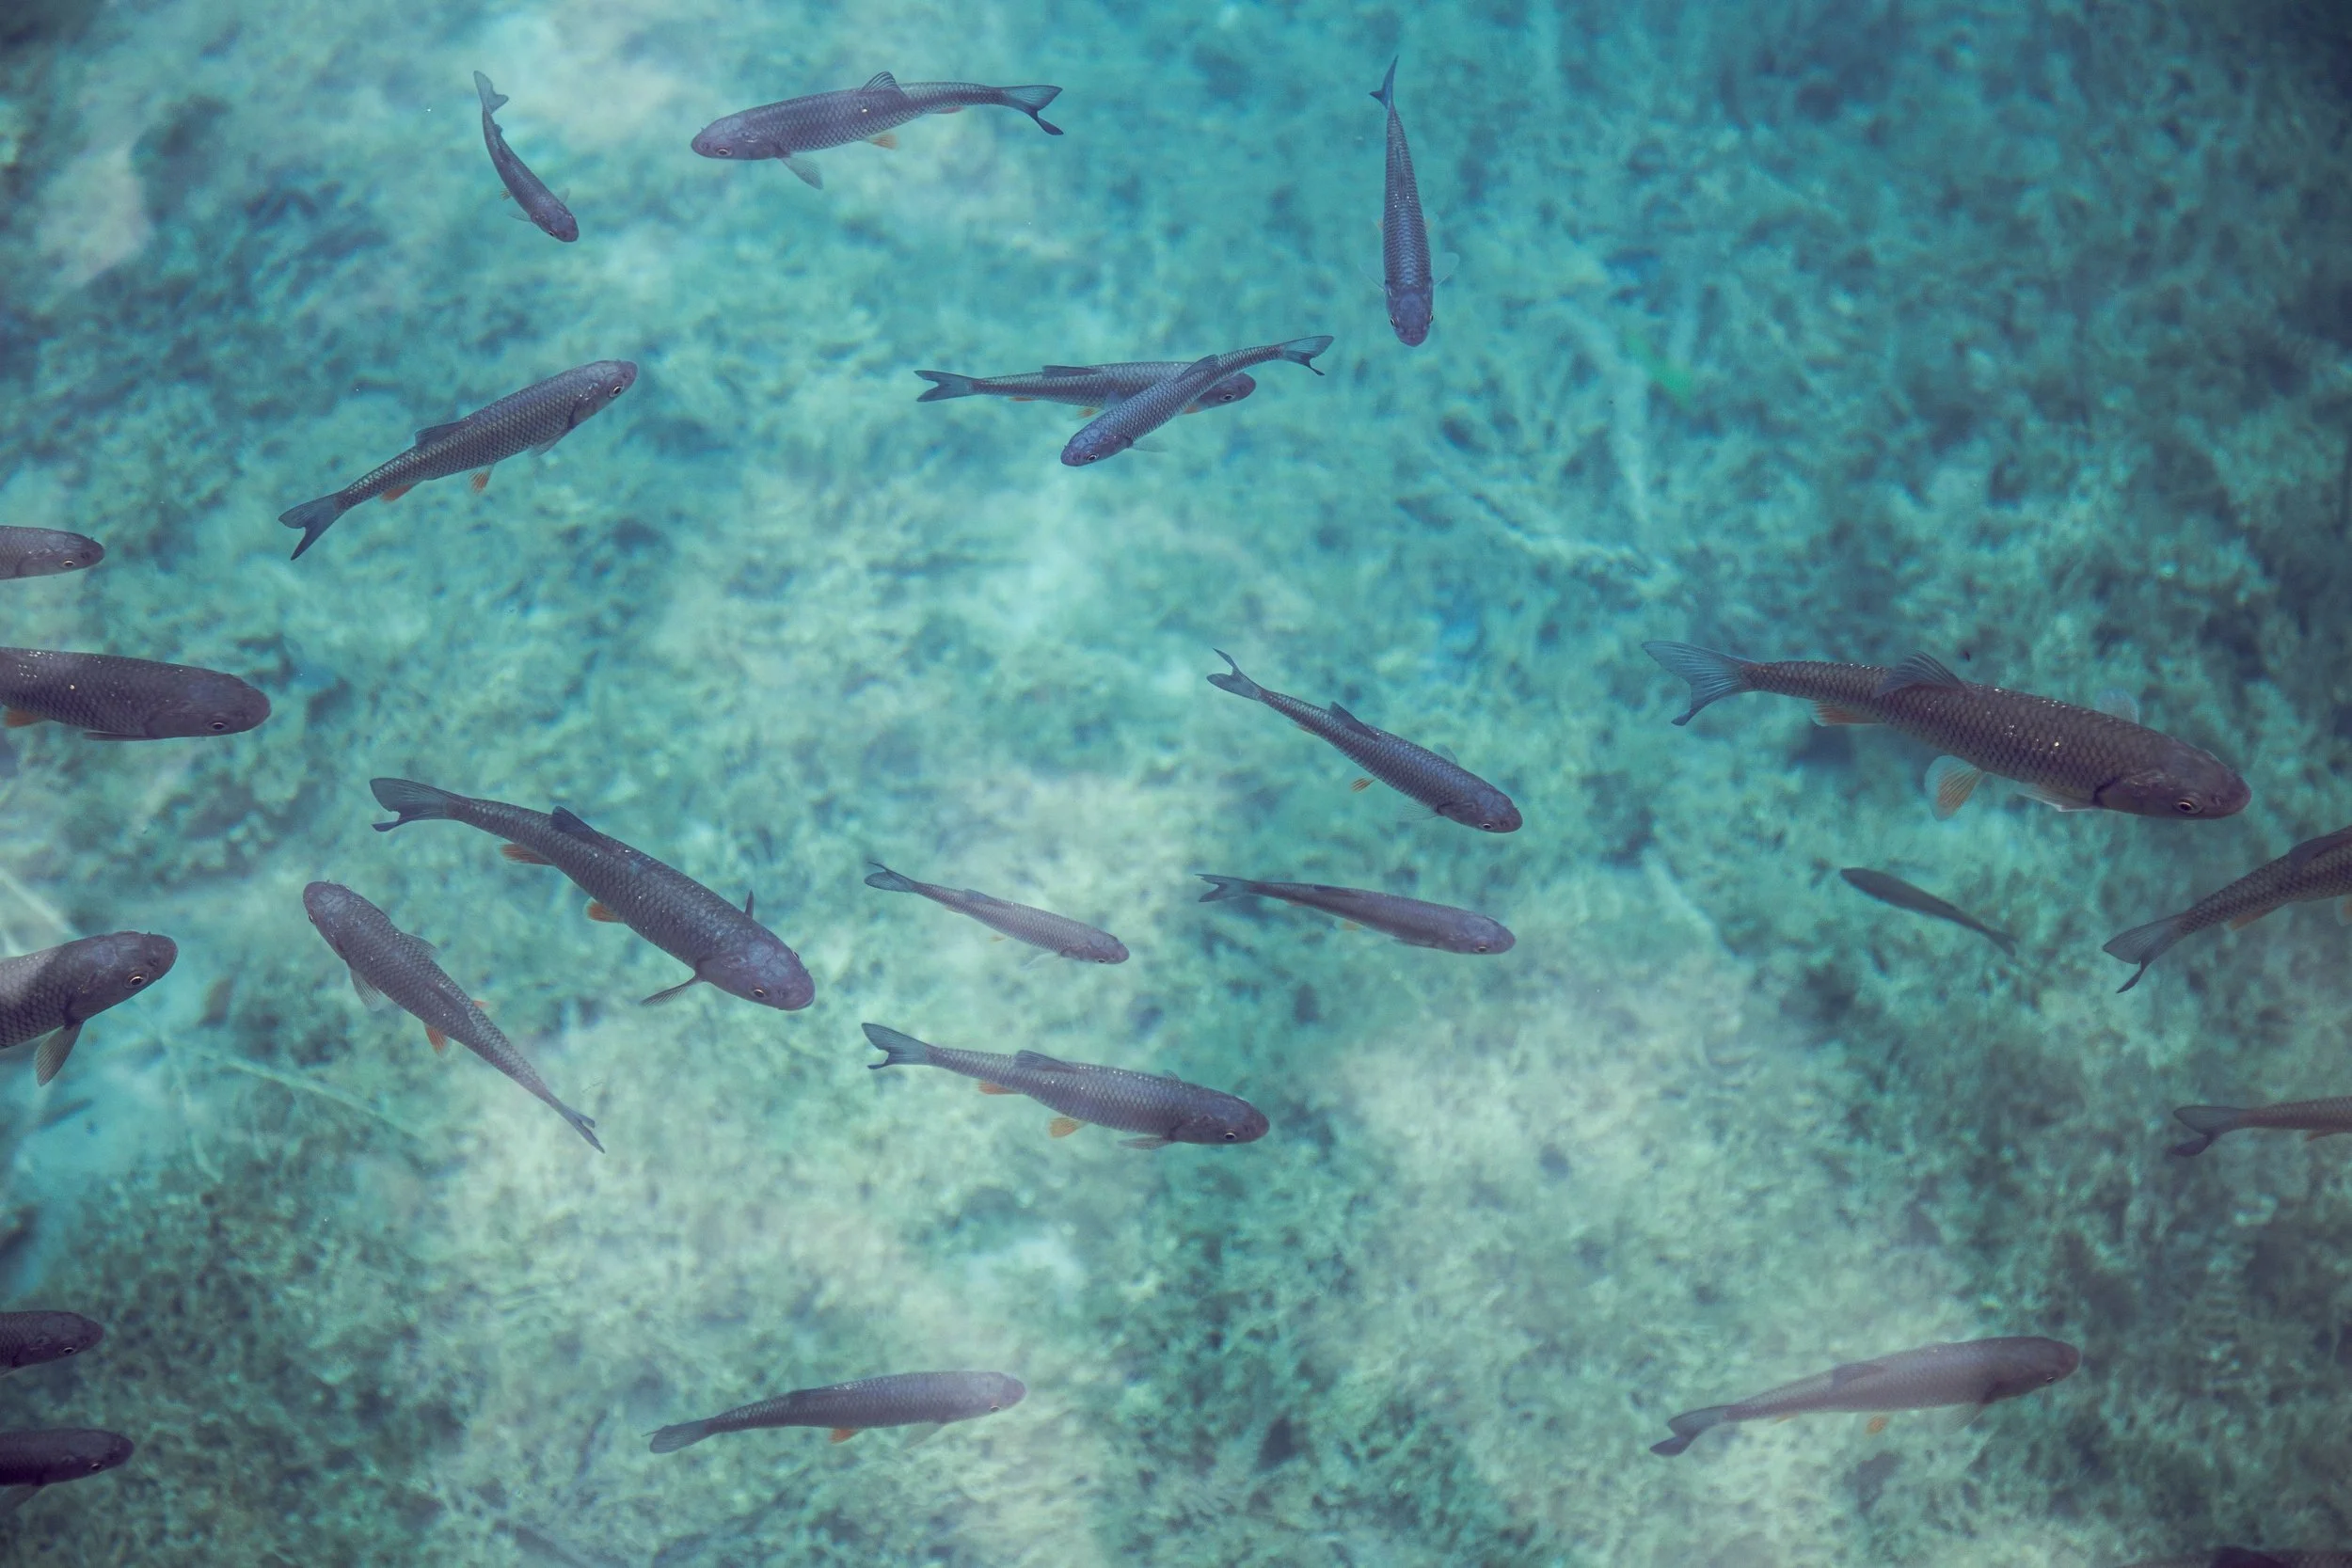
Giigoonyag - Fish
General Population Higlights 2026
Walleye Concerns: Northern Wisconsin faces recruitment bottlenecks where fingerlings disappear by July, prompting adjusted state-tribal monitoring and reduced state targets of 4.3 million total stocked fish for 2026 due to budget adjustments.
Lake Winnebago Sturgeon: The Winnebago system maintains the largest lake sturgeon population in the world, supported by ongoing multi-agency management.
Local Die-offs: Spot surveys (such as in Manitowoc County's Silver Lake) show temporary drops in largemouth bass and walleye from low winter oxygen, while panfish and northern pike remain resilient.
Trout Stocking: State programs are distributing 326,000 catchable-size trout (including brook, brown, and rainbow trout) to public waters in 2026.
Waawaashkeshi - Deer
Population & Herd Status 2025
Pre-hunt size: Entered the 2025 season with over 2 million deer statewide, bolstered by consecutive mild winters.
Post-hunt size: Settled at an estimated 1.89 million deer, representing a second straight year of record-high herd levels.
Growth factors: High fawn survival rates and low winter-related mortality.
Harvest Totals 2025
Total harvest: Hunters registered 338,685 total deer across all 2025-2026 state hunting periods, about 4% higher than the previous year.
Gun season harvest: The 9-day gun deer season yielded 182,084 registered deer (down 0.8% from 2024), which included 86,068 antlered bucks and 96,016 antlerless deer.
Buck harvest: Reached 165,614 total bucks for the year, marking the highest buck kill tally since 2012.
Manoomin - Wild Rice
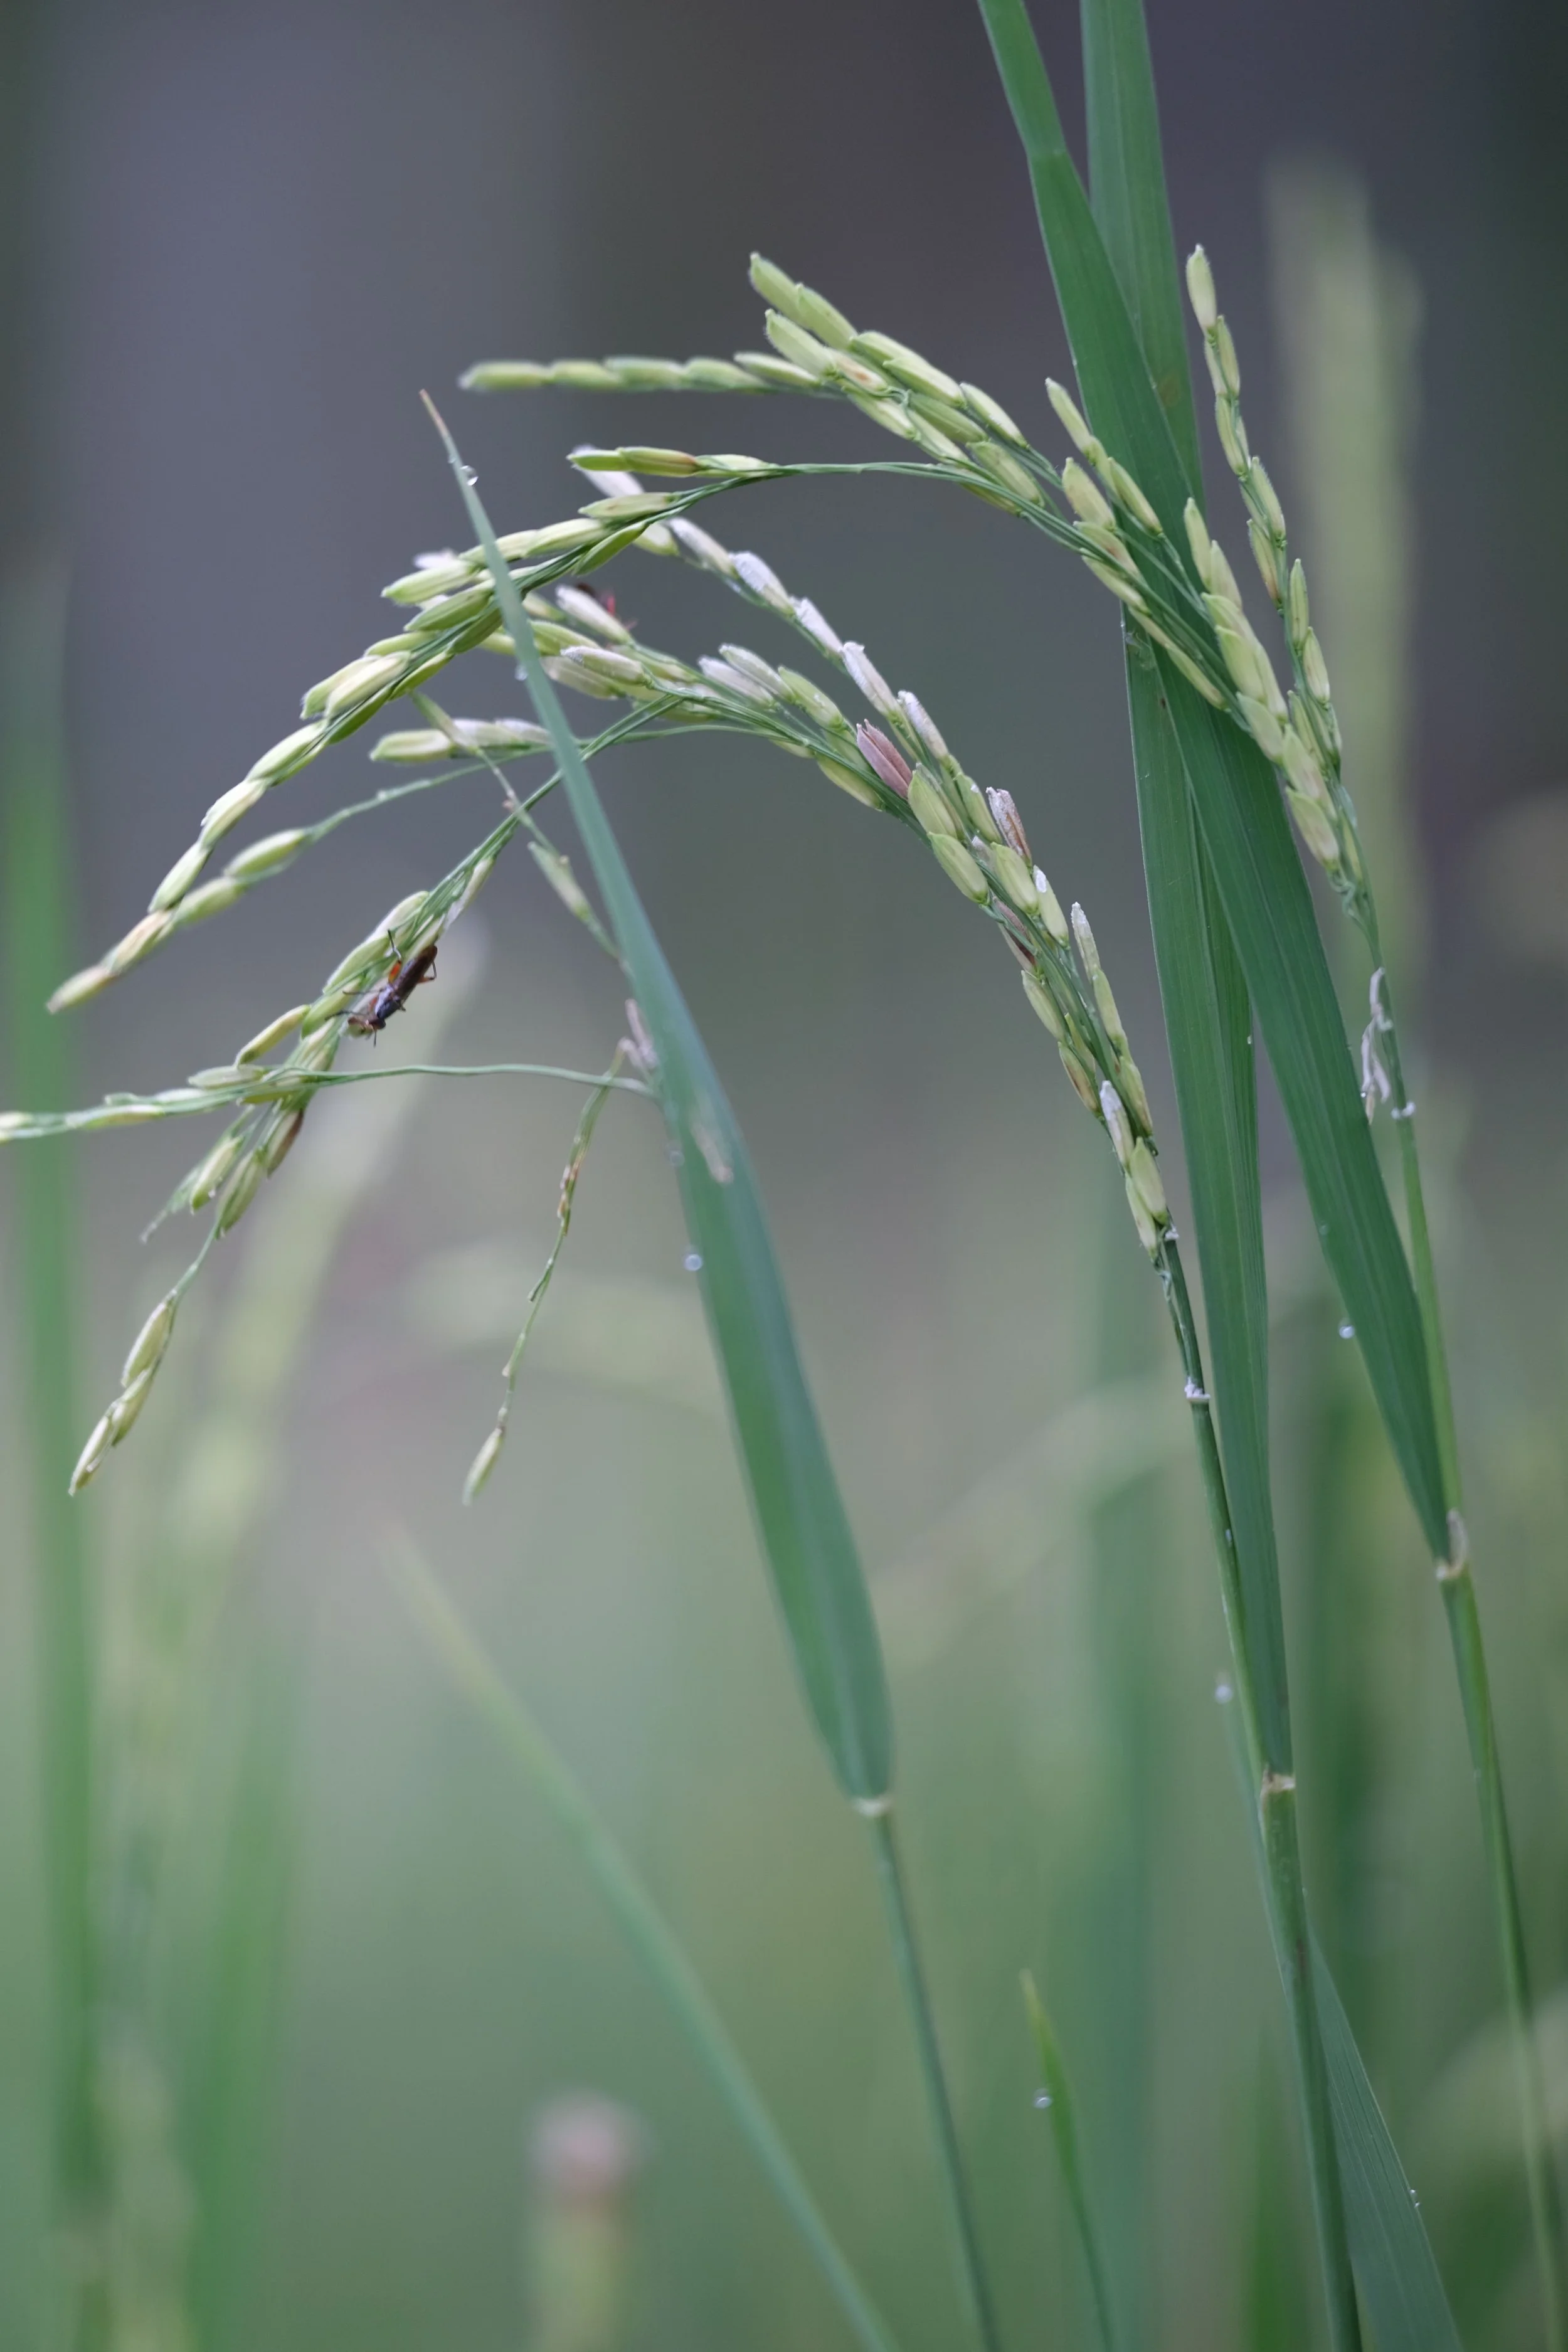
Northern Wisconsin's 2025 wild rice crop faced an 18% decline in surface area coverage compared to the previous year, driven primarily by severe mid-summer storms and high water levels. For official guidelines, updates, and rules on harvesting, check the Wisconsin DNR Wild Rice Harvesting page or view regional tracking via the Great Lakes Indian Fish & Wildlife Commission.
Harvest & Production Factors 2025
Surface Coverage Drop: Satellite imagery evaluated by the Great Lakes Indian Fish & Wildlife Commission revealed an 18% reduction in regional wild rice surface area from 2024.
Weather Disruptions: A fast-moving mid-June windstorm and sudden late-June downpours (dropping 6–7 inches of rain locally) caused high-water fluctuations and physical damage.
Boating Impacts: Wakes from boats during vulnerable early-growth phases threatened to uproot young stalks, prompting slow-wake advisories.
Varying Local Yields: While overall regional output was low, localized results varied; some specific top lakes showed minor rebounds while others remained poor or closed entirely (such as select areas in Vilas County).

REGIONAL PUBLICATIONS
〰️
REGIONAL PUBLICATIONS 〰️
Farming
Fishing
Intertribal Agriculture Council - Great Lakes Technical Assistants Contact
Eroding productivity of walleye populations in northern Wisconsin lakes
We Are the Stewards: Indigenous-Led Fisheries Innovation in North America
Great Lakes Inter Tribal Council Farming, hunting, fishing specific information